
You've received your NHS blood test results, but the numbers and medical terms feel overwhelming. Many people assume these results are too complex to understand without a medical degree, yet interpreting them correctly can transform your health journey. This guide breaks down common NHS blood tests, explains what the numbers mean, and shows you practical steps to improve your wellbeing based on your results. Whether you're managing a chronic condition or simply optimising your health, understanding your blood work empowers you to make informed decisions about nutrition, lifestyle, and when to seek medical advice.
Table of Contents
- Understanding Your NHS Blood Test Results
- Common Indicators And What They Mean For Your Health
- How To Respond To Your NHS Blood Test Results
- Comparing NHS Results With Personal Health Goals
- Discover Personalised Health Management With ClearUp
- How To Interpret NHS Results: Frequently Asked Questions
Key takeaways
| Point | Details |
|---|---|
| Understand blood test components | NHS tests measure cholesterol, glucose, liver function, and blood count, each revealing different aspects of your health. |
| Know when to act | Results outside normal ranges may require lifestyle changes, medical follow-up, or simply monitoring over time. |
| Apply practical steps | Use your results to guide nutrition, exercise, and sleep habits for measurable health improvements. |
| Avoid interpretation pitfalls | Normal ranges vary by individual, and single tests rarely tell the complete story without professional context. |
Understanding your NHS blood test results
Your NHS blood test report contains measurements that reflect how well your body systems are functioning. Common NHS blood tests typically include a full blood count, lipid profile for cholesterol, liver function tests, and glucose measurements. Each component serves a specific purpose: a full blood count evaluates your red and white blood cells, cholesterol tests assess cardiovascular risk, liver function markers indicate how well your liver processes substances, and glucose levels reveal your blood sugar control.
Reading your results means comparing your numbers against reference ranges printed on the report. These ranges represent values considered normal for most adults, but here's where it gets interesting. Your ideal numbers might differ based on age, sex, medications, and existing health conditions. A result slightly outside the reference range doesn't automatically signal a problem, whilst a result within normal limits might not be optimal for your personal health goals.
NHS reports typically display results in a table format with three columns: the test name, your value, and the reference range. Values flagged as high or low appear marked, drawing attention to potential concerns. However, context matters enormously. A single elevated reading might reflect temporary factors like recent meals, stress, or dehydration rather than a chronic issue.
Pro Tip: Reference ranges represent the middle 95% of healthy people, meaning 5% of perfectly healthy individuals will fall outside these ranges naturally. Always discuss flagged results with your GP before assuming something is wrong, especially if you feel well and have no symptoms.
Key components you'll encounter include:
- Haemoglobin and red blood cell counts indicating oxygen transport capacity
- White blood cell counts reflecting immune system function
- Platelet levels showing blood clotting ability
- Cholesterol fractions revealing cardiovascular health
- Liver enzymes measuring organ function
- Glucose indicating blood sugar control
Common indicators and what they mean for your health
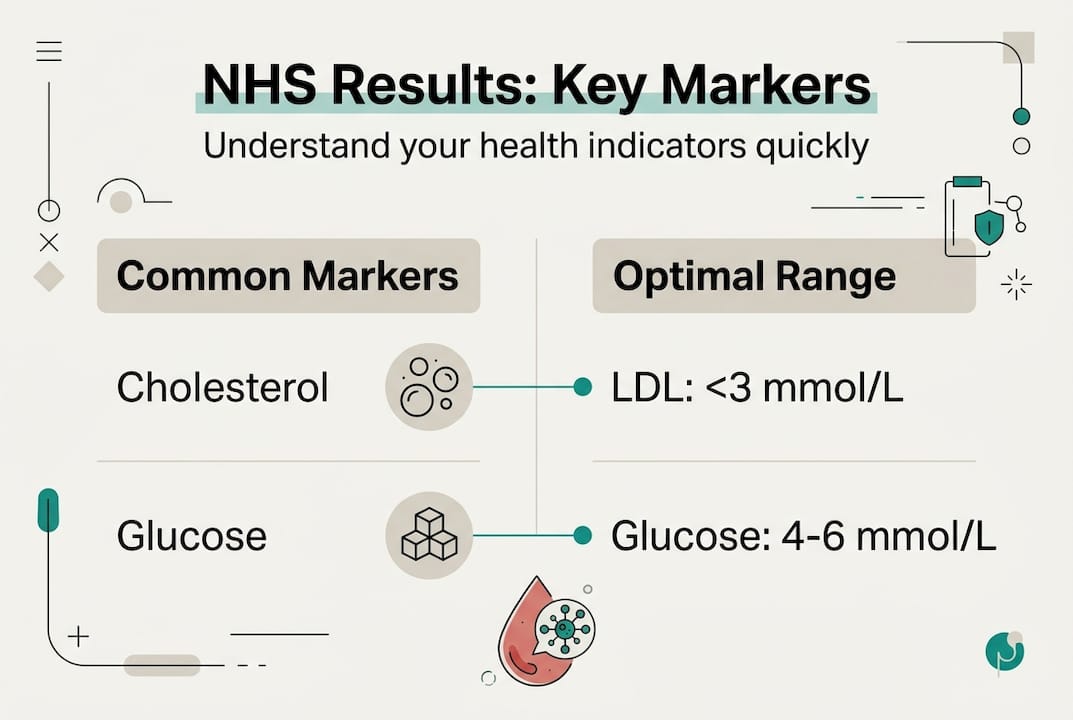
Cholesterol measurements split into LDL and HDL types, and this distinction matters tremendously for heart health. LDL cholesterol carries fatty deposits to artery walls, increasing heart disease risk when elevated, whilst HDL cholesterol removes these deposits, providing protection. Your total cholesterol number alone tells an incomplete story. You want LDL below 3.0 mmol/L and HDL above 1.0 mmol/L for men or 1.2 mmol/L for women, though optimal targets may be lower if you have existing heart disease.
Glucose levels indicate how well your body manages blood sugar. Fasting glucose should sit between 4.0 and 5.9 mmol/L, whilst HbA1c (a three month average) should stay below 42 mmol/mol. Values above these thresholds suggest prediabetes or diabetes risk. Even slightly elevated glucose deserves attention because early intervention through diet and activity can prevent progression to full diabetes.

Liver function tests measure enzymes like ALT, AST, and GGT that leak into blood when liver cells are damaged. Elevated levels might indicate fatty liver disease, alcohol effects, medication side effects, or viral hepatitis. Your liver remarkably regenerates when you address the underlying cause, making these markers excellent for tracking improvement. Bilirubin and albumin provide additional liver health information, with bilirubin showing how well your liver processes waste and albumin reflecting protein production.
Pro Tip: Lifestyle factors dramatically affect these markers within weeks. Reducing alcohol, losing 5 to 10% of body weight, and increasing fibre intake can lower LDL cholesterol by 10 to 20%, whilst regular exercise improves insulin sensitivity and glucose control. However, persistently abnormal results despite lifestyle changes warrant medical investigation for underlying conditions requiring treatment.
| Marker | Optimal Range | What High Levels Suggest | What Low Levels Suggest |
|---|---|---|---|
| LDL Cholesterol | Below 3.0 mmol/L | Increased heart disease risk | Rare, may indicate malnutrition |
| HDL Cholesterol | Above 1.0 mmol/L (men), 1.2 mmol/L (women) | Protective effect | Higher cardiovascular risk |
| Fasting Glucose | 4.0 to 5.9 mmol/L | Diabetes or prediabetes risk | Hypoglycaemia, medication effects |
| ALT (Liver Enzyme) | Below 40 U/L | Liver inflammation or damage | Normal, no concern |
| Haemoglobin | 130 to 180 g/L (men), 120 to 160 g/L (women) | Dehydration, lung disease | Anaemia, nutritional deficiency |
How to respond to your NHS blood test results
Start by reviewing which results fall outside normal ranges and by how much. Marginally abnormal results often need monitoring rather than immediate intervention, whilst significantly abnormal values require prompt medical attention. Your GP will typically contact you if results need urgent action, but don't wait passively if you notice concerning patterns.
Follow this systematic approach:
- Compare your current results with previous tests to identify trends rather than focusing on single values.
- Note any symptoms you're experiencing that might relate to abnormal markers.
- Research the specific markers that are flagged, understanding what they measure and why they matter.
- Schedule a GP appointment to discuss results, bringing a list of questions and concerns.
- Request a follow-up test timeline if results need monitoring over time.
When consulting your GP, ask specific questions about what your results mean for your health risks, whether lifestyle changes could help, and if medication might be necessary. Effective interpretation involves combining test results with your medical history, symptoms, and risk factors. Your doctor can explain whether abnormal results reflect a temporary issue or chronic condition requiring ongoing management.
Lifestyle modifications can powerfully influence many blood markers. For cholesterol management, increase soluble fibre through oats, beans, and vegetables whilst reducing saturated fat from red meat and full-fat dairy. For glucose control, focus on low glycaemic index foods, regular meals, and consistent physical activity. Liver function improves with alcohol reduction, weight loss if overweight, and avoiding unnecessary medications.
Tracking your health progress over time reveals whether your interventions are working. Keep copies of all blood test results in a folder or digital file, noting the date and any lifestyle changes you've made. This record becomes invaluable for spotting patterns and demonstrating improvement to healthcare providers. Many people find that seeing numerical improvements motivates continued healthy behaviours.
Consider these evidence-based interventions:
- Nutrition adjustments targeting specific markers through food choices
- Regular aerobic exercise for 150 minutes weekly to improve insulin sensitivity and cholesterol
- Sleep optimisation for seven to nine hours nightly, as poor sleep worsens glucose control and inflammation
- Stress management through mindfulness or relaxation techniques that reduce cortisol
- Targeted supplementation under professional guidance when dietary changes prove insufficient
Comparing NHS results with personal health goals
Your blood test interpretation should align with your individual health objectives and medical context. Someone managing diabetes focuses intensely on glucose and HbA1c, whilst someone with family heart disease history prioritises cholesterol fractions and inflammatory markers. Personal health goals provide essential context for determining which results matter most and what targets to pursue.
Standard reference ranges represent population averages, but optimal values for longevity and disease prevention often sit in the lower portion of normal ranges. For instance, whilst LDL cholesterol below 3.0 mmol/L is considered acceptable, research suggests levels below 2.0 mmol/L provide maximum cardiovascular protection. Similarly, fasting glucose in the higher normal range (5.5 to 5.9 mmol/L) carries greater diabetes risk than values below 5.0 mmol/L.
Different health conditions require different interpretation frameworks. Someone with established heart disease needs aggressive cholesterol lowering, often targeting LDL below 1.4 mmol/L. People with fatty liver disease focus on liver enzyme trends and weight loss progress. Those with anaemia track haemoglobin and iron studies to ensure treatment effectiveness. Your results gain meaning only when viewed through your specific health situation.
| Health Goal | Key Markers to Monitor | Optimal Targets | Lifestyle Focus |
|---|---|---|---|
| Cardiovascular disease prevention | LDL, HDL, triglycerides, blood pressure | LDL below 2.0 mmol/L, HDL above 1.5 mmol/L | Heart-healthy fats, regular aerobic exercise |
| Diabetes management | Fasting glucose, HbA1c | HbA1c below 48 mmol/mol, fasting glucose 4.0 to 6.0 mmol/L | Low glycaemic diet, consistent meal timing |
| Liver health optimisation | ALT, AST, GGT | All below 30 U/L | Alcohol reduction, weight management |
| Energy and vitality | Haemoglobin, ferritin, vitamin B12, thyroid function | Mid-normal ranges for all markers | Iron-rich foods, adequate protein |
| Weight management | Glucose, lipids, liver function | All within optimal ranges | Calorie balance, nutrient density |
Setting realistic targets based on your results requires honest assessment of current habits and sustainable change capacity. Dramatic improvements rarely happen overnight. Expect cholesterol to drop 10 to 15% over three months with consistent dietary changes. Glucose control improves within weeks of regular exercise and carbohydrate management. Liver enzymes can halve within two to three months of alcohol cessation and weight loss.
Consider these factors when interpreting your results:
- Your age and sex, as reference ranges and risk calculations differ
- Family history of conditions like heart disease, diabetes, or high cholesterol
- Current medications that might affect test results
- Recent lifestyle changes that haven't yet shown up in blood work
- Timing of tests relative to meals, exercise, or illness
Meal planning tailored to your blood results accelerates progress toward health goals. If cholesterol is elevated, emphasise plant sterols, omega-3 fatty acids, and soluble fibre. For high glucose, structure meals around protein, healthy fats, and non-starchy vegetables whilst limiting refined carbohydrates. Personalised health plans account for your preferences, schedule, and specific markers needing attention, making adherence far more achievable than generic advice.
Discover personalised health management with ClearUp
Interpreting your NHS blood test results is just the beginning. ClearUp transforms those numbers into actionable guidance tailored specifically for your health profile. The platform analyses your lab values and creates personalised nutrition plans, supplement recommendations, and lifestyle strategies designed to optimise your markers. You'll see exactly which foods support your goals, how your daily habits affect your results, and track improvements over time.
Whether you're managing cholesterol, improving glucose control, or simply pursuing optimal wellness, ClearUp provides the insights and support you need. Track your health progress with intuitive tools that connect your lifestyle choices to measurable outcomes. Access personalised nutrition guidance that addresses your specific blood markers. Use comprehensive lab test interpretation to understand what your results truly mean and how to improve them through evidence-based interventions.
How to interpret NHS results: frequently asked questions
How long does it take to receive NHS blood test results?
Most routine NHS blood test results arrive within one to two weeks, though urgent tests may be processed within 24 to 48 hours. Your GP surgery typically contacts you if results require immediate attention, otherwise you can phone the surgery or check online through the NHS App after the expected timeframe. Some surgeries automatically send results via post or make them available through patient portals.
Do all abnormal blood test results require treatment?
No, many abnormal results simply need monitoring or lifestyle modification rather than medication. Marginally elevated cholesterol often responds to dietary changes and exercise, whilst slightly low iron might improve with food choices alone. Your GP determines treatment necessity based on how far results deviate from normal, your symptoms, risk factors, and whether values are trending worse over time.
Can lifestyle changes really improve blood test results?
Absolutely, lifestyle modifications often produce dramatic improvements within weeks to months. Weight loss of 5 to 10% can reduce liver enzymes by 30 to 50%, regular exercise improves insulin sensitivity and raises HDL cholesterol, and dietary changes lower LDL cholesterol by 10 to 20%. Sleep optimisation, stress reduction, and alcohol limitation also significantly impact multiple markers, sometimes eliminating the need for medication.
How often should I repeat blood tests?
Testing frequency depends on your results and health conditions. Normal results in healthy individuals might need rechecking every one to three years, whilst abnormal values often require retesting in three to six months to assess response to interventions. People managing chronic conditions like diabetes typically test every three to six months, and those starting new medications may need monitoring every few weeks initially.
What should I do if I don't understand my blood test results?
Schedule a GP appointment specifically to discuss your results, bringing a written list of questions about any markers you don't understand. Ask your doctor to explain what each abnormal value means, why it matters for your health, and what actions you should take. You can also request printed copies of results with explanations, or use reputable health platforms that help interpret lab values in plain language with personalised context.